In a previous post I show one way to visualize a redundancy analysis about genes constrained to environmental factors, RDA & venn & networks. But then, another way to aggregate several analyses in one plot, is to add clustering schemes. I used fuzzy clustering to get most of the patterns among the genome of larvae during their development. During that time, gene transcription is highly regulated across tissues and development time. While there is progress in the development of larvae, new tissues are being formed on a daily bases while others are destructed. To identify the genetic players of such events, it is better to think of gene networks.
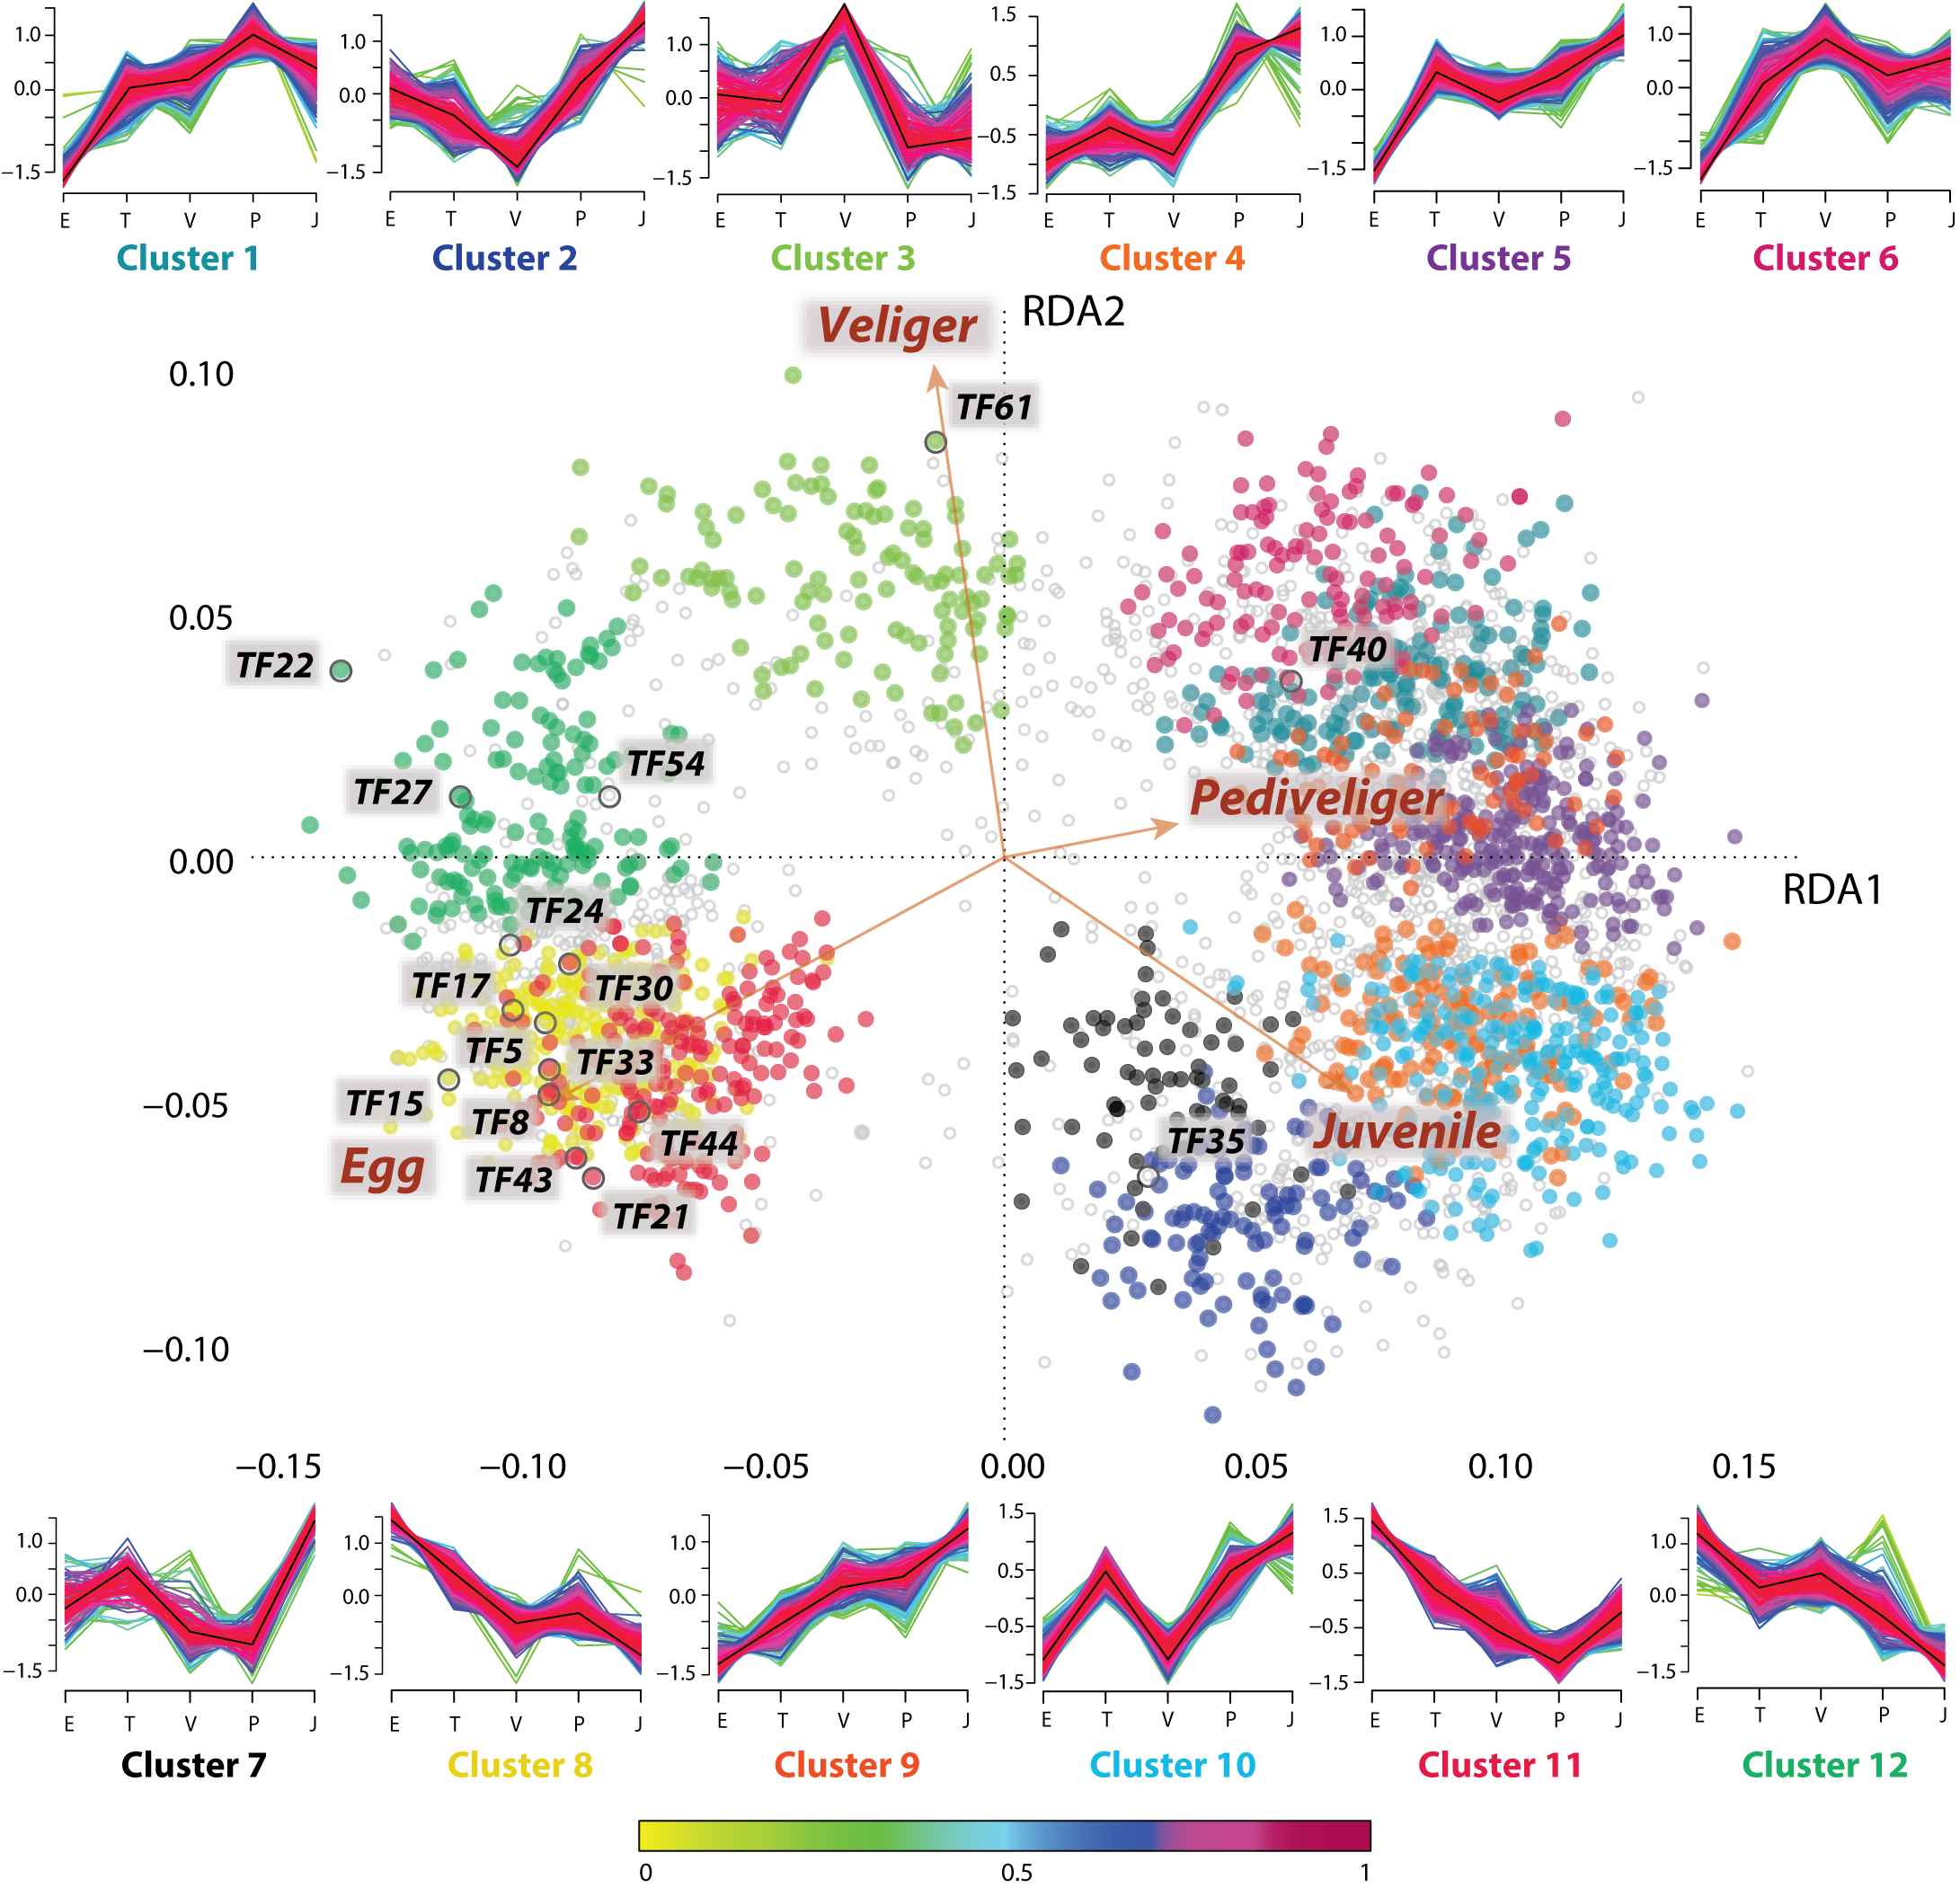
Hidden gene patterns are responsible of gene-gene interactions, which are responsible for triggering some specifically-timed molecular mechanisms. Below, I show how groups of genes (12 clusters around the RDA) have different patterns during developmental stages of larvae (egg, trocophore, veliger, pedivliger, and juveniles). The redundancy analysis constrain these clusters of genes to the different stage predictors. Also, I am showing special preferential genes, abbreviated as TF and a numerical id. These are transcription factors supposedly responsible of the regulation of these patterns.