For more than a decade, I’ve worked in academia to simplify carefully designed experiments. I covered diverse species from bacteria, invertebrates to human genetics. This blog will contain only original content and a closer look at my peer-reviewed analytics.
Posts will be centered about data visualization practices, for interpretability purposes. Alongside code gists featured from my Github repos.
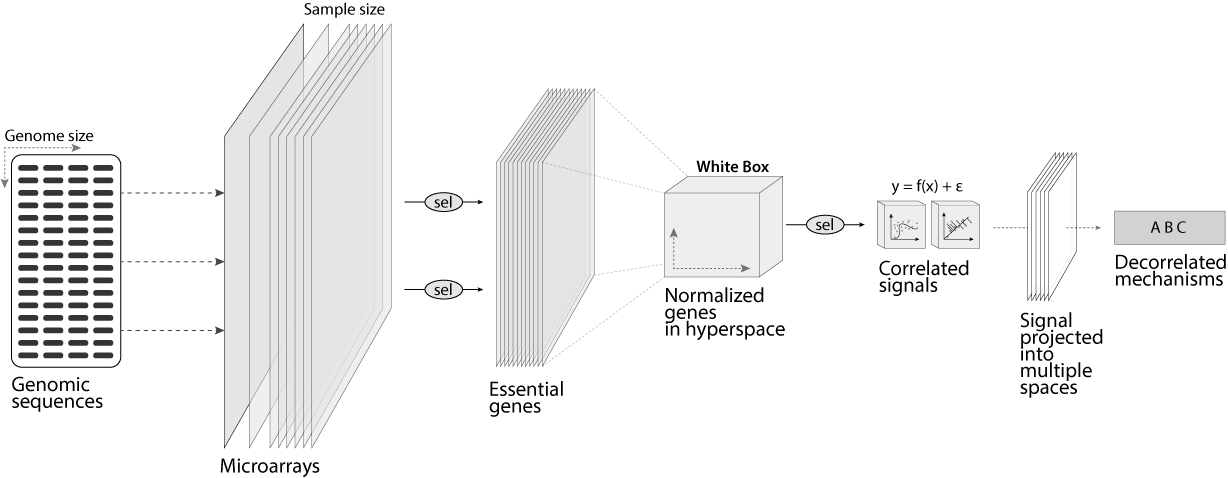
For example, below is the representation of a common gene profiling pipeline. It begins with the full size of the genome, sequenced or printed on glass microarrays. Next, the genome’s response is collected, where it converges into a white box that aggregates all genes across all samples. Lastly, rare signals are inferred using pattern recognition tools.

These tools implement computational techniques in genomics and statistics. Here is a list of techniques that describe what will be used on the genes in the white box:
- Feature engineering & regularization (lasso, ridge, elastic)
- Data subsetting, extraction, reformatting
- Subsampling, mini-batch sampling & bagging
- Data splitting (binomial and multiclass)
- Unsupervised learning (fuzzy, hierarchical clustering)
- Grid search for normalization & standardization methods
- Bayesian inferential models
- Similarity & adjacency matrices
- Multi-iterative module allocations for gene expressions
- Weighted genetic networks
- Supervised learning and grid hyper tuning
- Bootstrapping and model alpha adjustments
- Logging & performance metrics (ROC, AUROC, 95% CI, kappa)
- Various descriptive and performance plotting
- Nested cross-validation & iterative resampling structures
- Multi-class area under the ROC curve
- Feature importance scoring
- Confusion matrices & multi-prediction validation
- Redundancy and descriptive analyses
- Machine learning optimizations
- Random seeding optimizations
- Over 20 machine learning models
- Deep learning (Mxnet, H2O, Keras)
